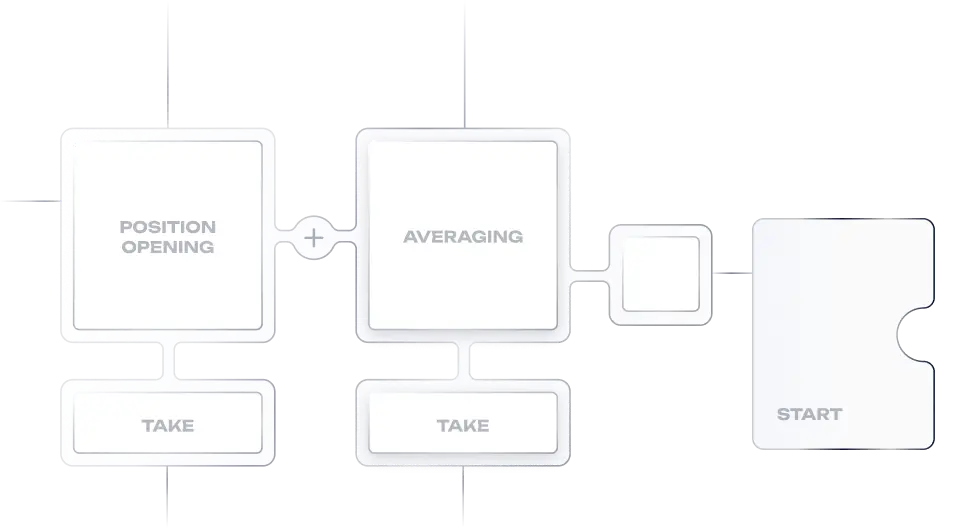

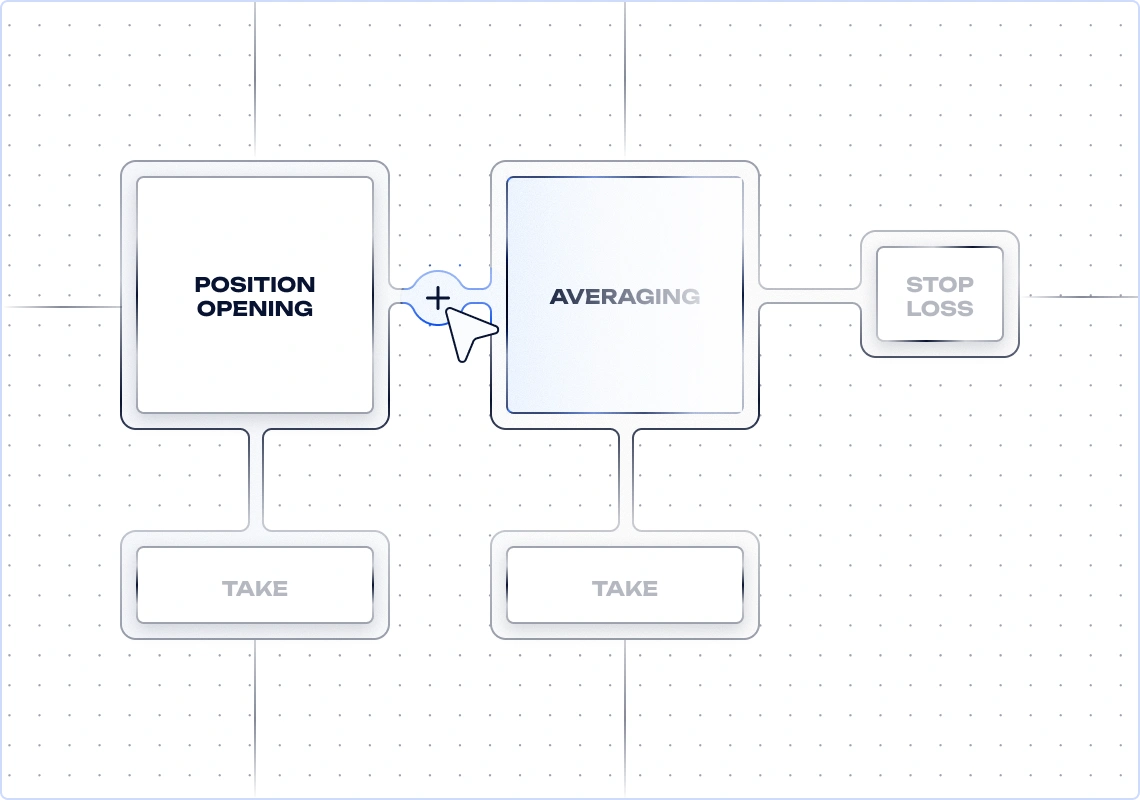
Deal map
The entire trade on one map. You manage the stages,
not a maze of settings.
not a maze of settings.
Set the entry, add averaging orders when needed, define the exit and stop-loss. Everything is visual, with clear connections and full control over the logic.
See the entire trade flow at a glance
Entry, averaging orders, exit, and stop-loss on a single map. See how the stages connect - when averaging turns on and what stopped the trade. Nothing is hidden in settings.
The structure stays clear at any level of complexity.
Add or remove averaging orders, and the map stays easy to read. Even multi-step logic remains transparent.
Know what the bot will do before launch.
The strategy reads like an action map. One look at the flow replaces
checking dozens of parameters and helps prevent mistakes.
checking dozens of parameters and helps prevent mistakes.
Control risk at the scenario level.
Risk is managed directly within the trade map.
Create strategy variations quickly.
Each stage is independent. Change only the stage you need – exit, averaging orders, or stop-loss. The rest of the logic stays untouched.
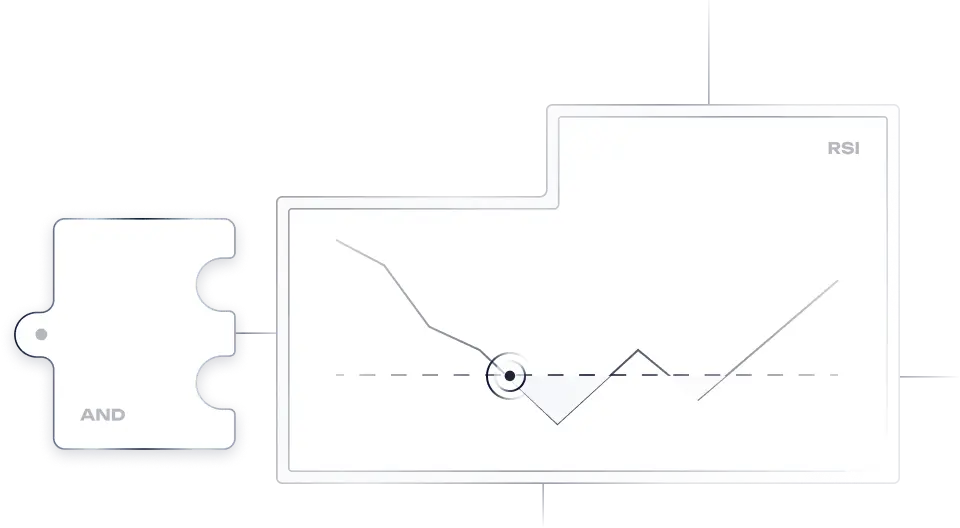
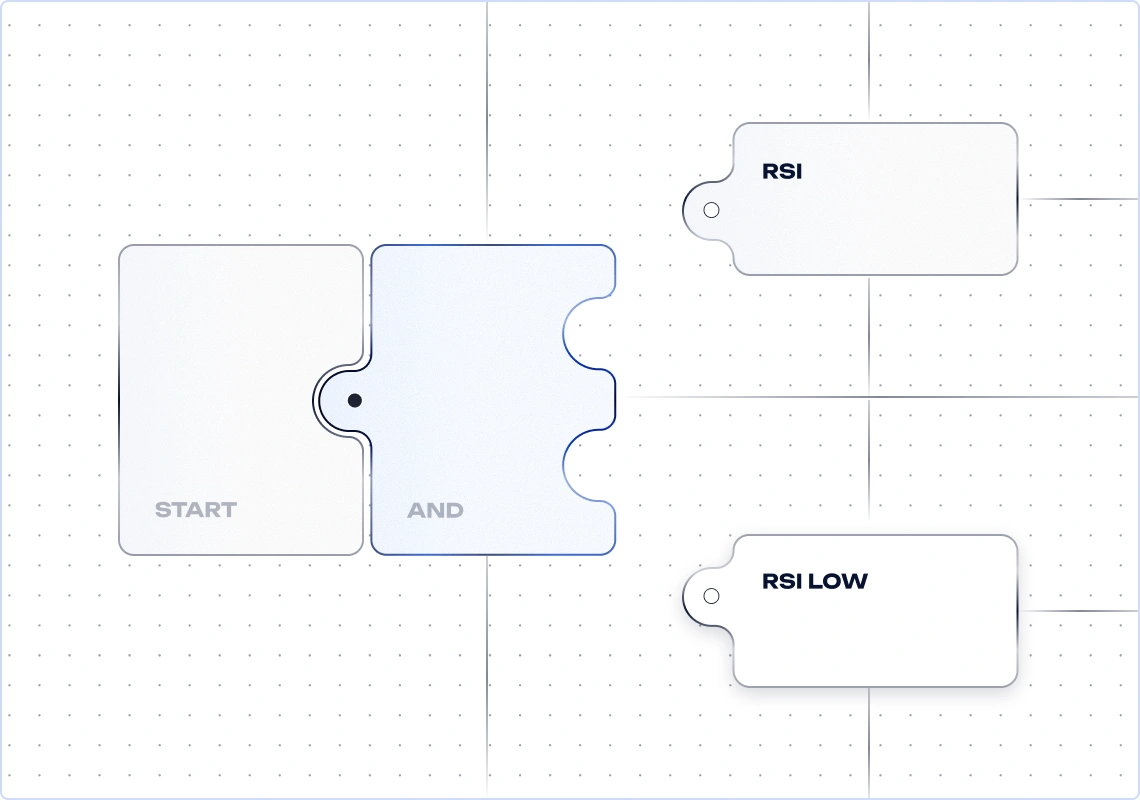
Puzzle builder
Combine trading conditions any way you need - no code, no rigid templates.
Combine price, indicators, crossovers, local highs and lows, rate of change, volume, and nested conditions. Complex logic becomes a clear visual structure - not a hidden list of parameters.
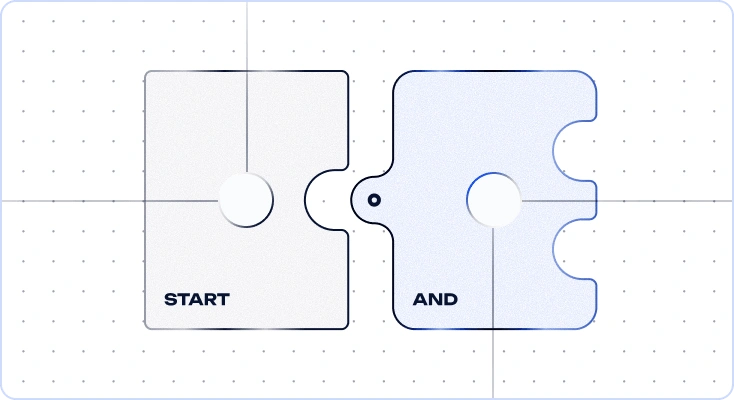
Conditions of any complexity
Build simple rules or nested logic such as A AND (B OR C) OR D.
Precise indicator signals
Use extremes, momentum shifts, and relationships between metrics as entry or exit conditions.
Volume signals and market reaction
Use volume, confirmations, and behavior in related assets to filter weak signals.
Flexible strategy logic
Create different rule sets for trends, ranges, breakouts, and pullbacks.
Fast creation of new strategies
Save condition blocks and reuse them across strategies without rebuilding from scratch.
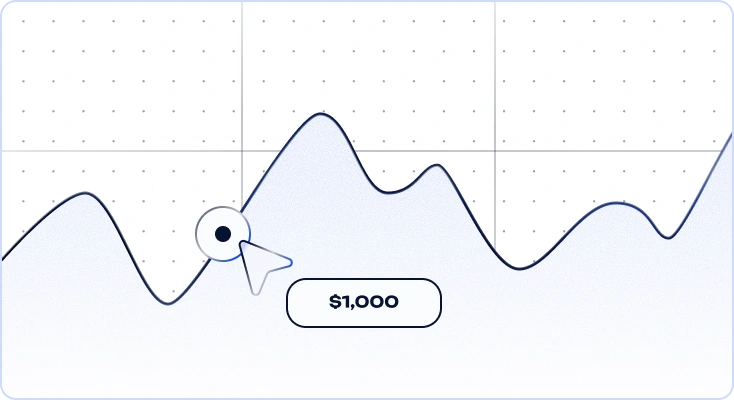
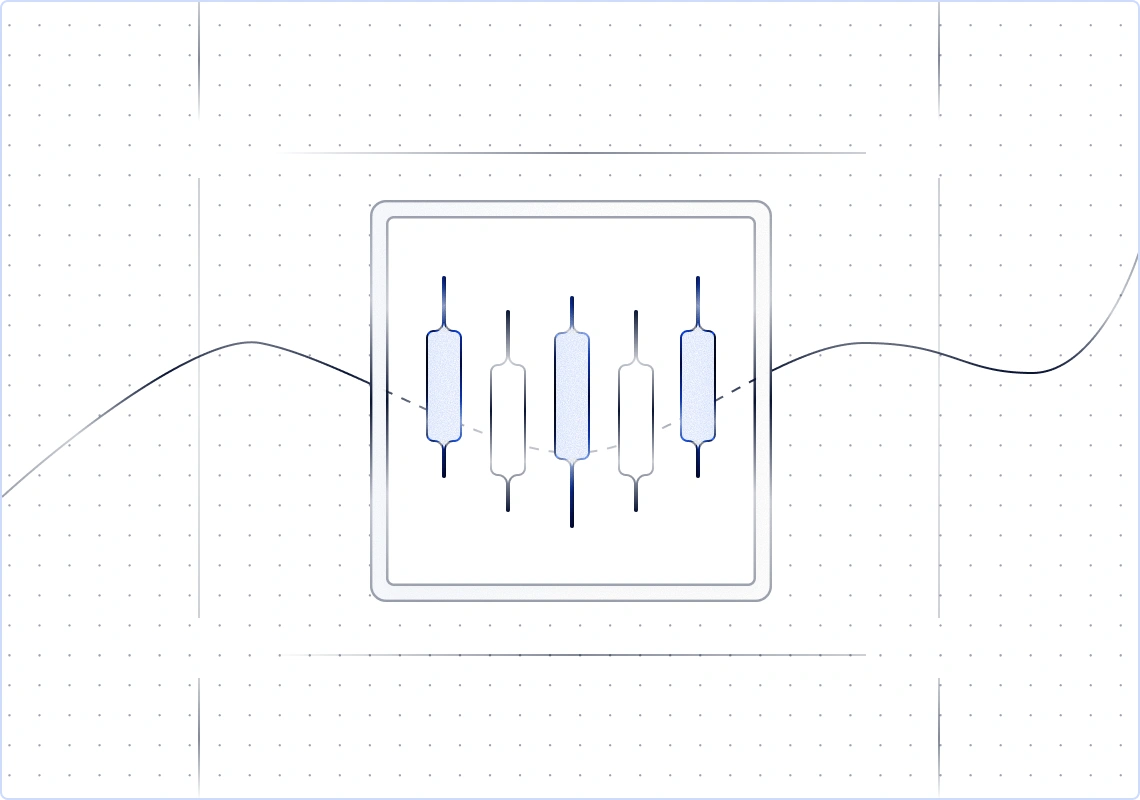
Visual debugger
See why a trade triggered and fine-tune your strategy in seconds
The debugger highlights the exact chart zones tied to each condition. See precisely why a trade opened and refine your strategy faster, with no guesswork.
Every condition is visible on the chart
No guesswork – you can see exactly where and when each condition was met.
False signals and rule conflicts are easy to spot
See where a condition reacts to noise or where one rule blocks another. Find the issue on the chart and fix it precisely.
See exactly what is blocking the entry
Identify which condition is keeping the trade from opening, and in which market zone, without endlessly tweaking parameters. Find the bottleneck in seconds.
The line between 'almost' and 'triggered'
See how close a condition came to triggering and fine-tune thresholds with confidence.
Debug like an engineer
One quick look at the highlighted zones can save dozens of wasted backtests. Instead of endless trial and error, you can see, understand, and fix.


.png)
.webp)